matplotlib :
Matplotlib is a low level graph plotting library in python that serves as a visualization utility.
Matplotlib was created by John D. Hunter.
Matplotlib is open source and we can use it freely.
Matplotlib is mostly written in python, a few segments are written in C, Objective-C and Javascript for Platform compatibility.
#in terminal:
poetry add Matplotlib
#in code:
import matplotlib

print(matplotlib.__version__)
Pyplot Most of the Matplotlib utilities lies under the pyplot submodule, and are usually imported under the plt alias:
import matplotlib.pyplot as plt
Now the Pyplot package can be referred to as plt.

Example
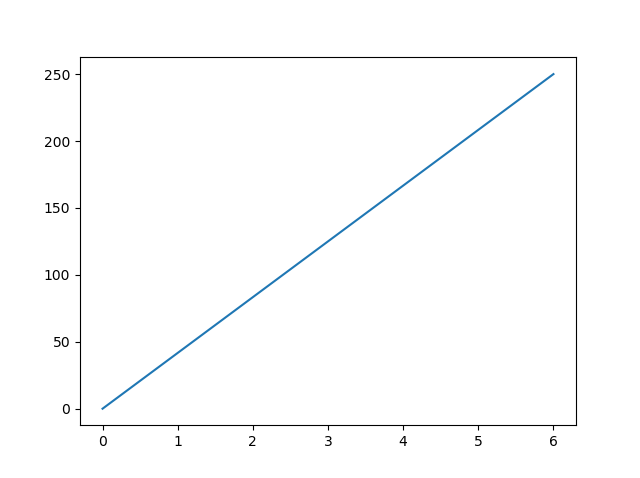
Draw a line in a diagram from position (0,0) to position (6,250):

import matplotlib.pyplot as plt
import numpy as np

xpoints = np.array([0, 6])
ypoints = np.array([0, 250])

plt.plot(xpoints, ypoints)
plt.show()
Result:

find more: matplotlib
Support or Contact:
Having trouble with Pages? Check out our : email or phone number : 0781912474 or contact support for gethub and we’ll help you sort it out. 🚑 🚑 🚑